Simple random sampling
Simple random sampling (SRS) is the baseline probability sampling method: every unit in the population has an equal chance of being selected, and every possible sample of size \(n\) is equally likely. It is the simplest design and the benchmark against which other methods are evaluated.
Definition
In simple random sampling, \(n\) units are selected from a population of size \(N\) such that:
- Every unit has selection probability \(n/N\).
- Every possible subset of size \(n\) is equally likely.
This requires a complete sampling frame: a list of all units in the population from which the sample is drawn. Without a frame, true SRS is not possible.
With vs without replacement
SRS with replacement
Each selected unit is returned to the population before the next draw. A unit can appear more than once in the sample. Each draw is independent: the sample consists of \(n\) independent and identically distributed (i.i.d.) observations.
\[P(\text{unit } i \text{ selected on any draw}) = \frac{1}{N}\]
SRS without replacement
Each selected unit is removed from the population. No unit appears more than once. Draws are not independent, but the estimators are more efficient because the same unit cannot contribute redundant information.
\[P(\text{unit } i \text{ selected}) = \frac{n}{N}\]
In practice, sampling without replacement is almost always used. Sampling with replacement is mostly a theoretical convenience (it simplifies proofs) and is the model assumed in bootstrap resampling.
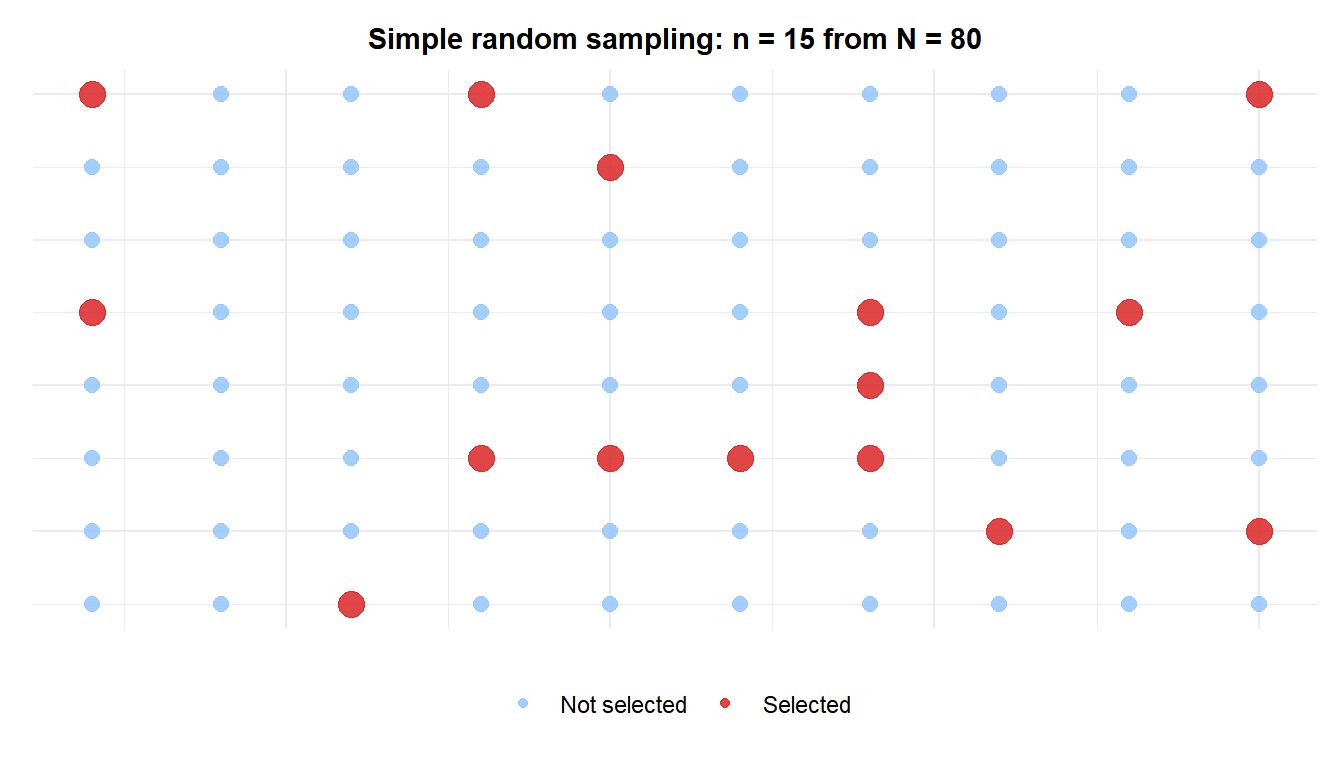
Each unit (blue) has the same probability of being selected. The red units are the sample: their positions in the grid are not systematic or clustered, reflecting true randomness.
Estimators under SRS
Under SRS without replacement, the standard estimators for the population mean and proportion are:
\[\hat{\mu} = \bar{x} = \frac{1}{n}\sum_{i=1}^n x_i, \qquad \hat{p} = \frac{x}{n}\]
Their variances include the finite population correction (FPC):
\[\text{Var}(\bar{x}) = \frac{\sigma^2}{n}\left(1 - \frac{n}{N}\right) = \frac{\sigma^2}{n} \cdot \text{FPC}\]
The FPC factor \((1 - n/N)\) accounts for the fact that sampling without replacement is more efficient than with replacement. When \(n/N < 0.05\) (the sample is less than 5% of the population), the FPC is close to 1 and can be ignored. For large populations relative to the sample, SRS with and without replacement give nearly identical standard errors.
Sample size
For estimating a proportion \(p\) with margin of error \(d\) at confidence \(1-\alpha\), the required sample size from a finite population of size \(N\) is:
\[n = \frac{N \cdot z_{\alpha/2}^2 \cdot p(1-p)}{(N-1) \cdot d^2 + z_{\alpha/2}^2 \cdot p(1-p)}\]
When \(N\) is very large (or unknown), the FPC vanishes and the formula simplifies to \(n = z_{\alpha/2}^2 p(1-p)/d^2\).
A supermarket chain wants to estimate the proportion of satisfied customers among its 50,000 loyalty card holders. Target: margin of error \(\pm 5\%\) at 95% confidence. Using \(p = 0.5\) (most conservative):
\[n = \frac{50000 \times 1.96^2 \times 0.25}{49999 \times 0.05^2 + 1.96^2 \times 0.25} = \frac{48020}{124.998 + 0.9604} \approx 381\]
A sample of 381 customers is needed. Since \(381/50000 = 0.76\%\), the FPC has almost no effect here.
How to select the sample in practice
With a numbered sampling frame, draw the sample using a random number generator. In R:
# Population of N = 1000, sample n = 100 without replacement
set.seed(42)
sample(1:1000, size = 100, replace = FALSE)

# With replacement
sample(1:1000, size = 100, replace = TRUE)
For physical sampling (paper lists, physical units), a random number table or a lottery (numbered slips drawn from a container) achieves the same result.
Advantages and limitations
SRS is unbiased and its standard errors are easy to compute. It is the natural starting point for any sampling design. However, it has practical limitations:
⚠️ SRS is inefficient for heterogeneous populations and impractical without a complete frame
Two main problems:
- No complete sampling frame: if you cannot list all population units, you cannot draw a truly random sample. Online surveys, phone polls, and intercept surveys use convenience samples, not SRS.
- Heterogeneous populations: if the population has distinct subgroups (age groups, regions, income levels), SRS may over (or under) represent them by chance. Stratified sampling ensures representation of each subgroup and is more efficient.
A sample of 400 people drawn randomly from a country of 40 million may, by chance, include very few elderly or very few rural residents. Stratified sampling prevents this.
💡 When SRS is the right choice
SRS works best when:
- A complete, up-to-date sampling frame is available.
- The population is relatively homogeneous (low variability between units).
- The sample size is small relative to the population (\(n/N < 5\%\)).
- Simplicity of implementation matters more than maximum efficiency.
For heterogeneous populations or when certain subgroups must be represented, stratified sampling is more appropriate. For geographically dispersed populations without a complete frame, cluster or multistage sampling is more practical.

