Analysis of covariance (ANCOVA)
ANCOVA (Analysis of Covariance) compares group means on a response variable while statistically controlling for a continuous covariate. It is not a separate method: it is a linear model with both categorical and continuous predictors. The practical benefit is twofold: reduced residual variance increases power, and adjusted means remove the confounding effect of the covariate.
ANCOVA as a linear model
For \(k\) groups and one covariate \(z\), ANCOVA is the regression:
\[y_{ij} = \mu + \alpha_i + \gamma z_{ij} + \varepsilon_{ij}\]
where \(\alpha_i\) is the effect of group \(i\) (with \(\sum \alpha_i = 0\) or one group as reference) and \(\gamma\) is the common slope of \(y\) on \(z\). In R matrix form: lm(y ~ group + z).
This model assumes parallel regression lines: the slope \(\gamma\) is the same in every group. The groups differ only in their intercepts (adjusted means). The covariate \(z\) is treated as a nuisance: we estimate and remove its effect to obtain a cleaner comparison of the group means.
Why does ANCOVA increase power? By explaining part of the residual variance with the covariate, the mean squared error (MSE) decreases. A smaller MSE means a larger F-statistic and higher power to detect group differences.
Example: teaching methods and prior knowledge
Three teaching methods (A, B, C) are compared on post-test scores, controlling for pre-test score (prior knowledge). Without controlling for the covariate, differences in pre-test ability confound the comparison.
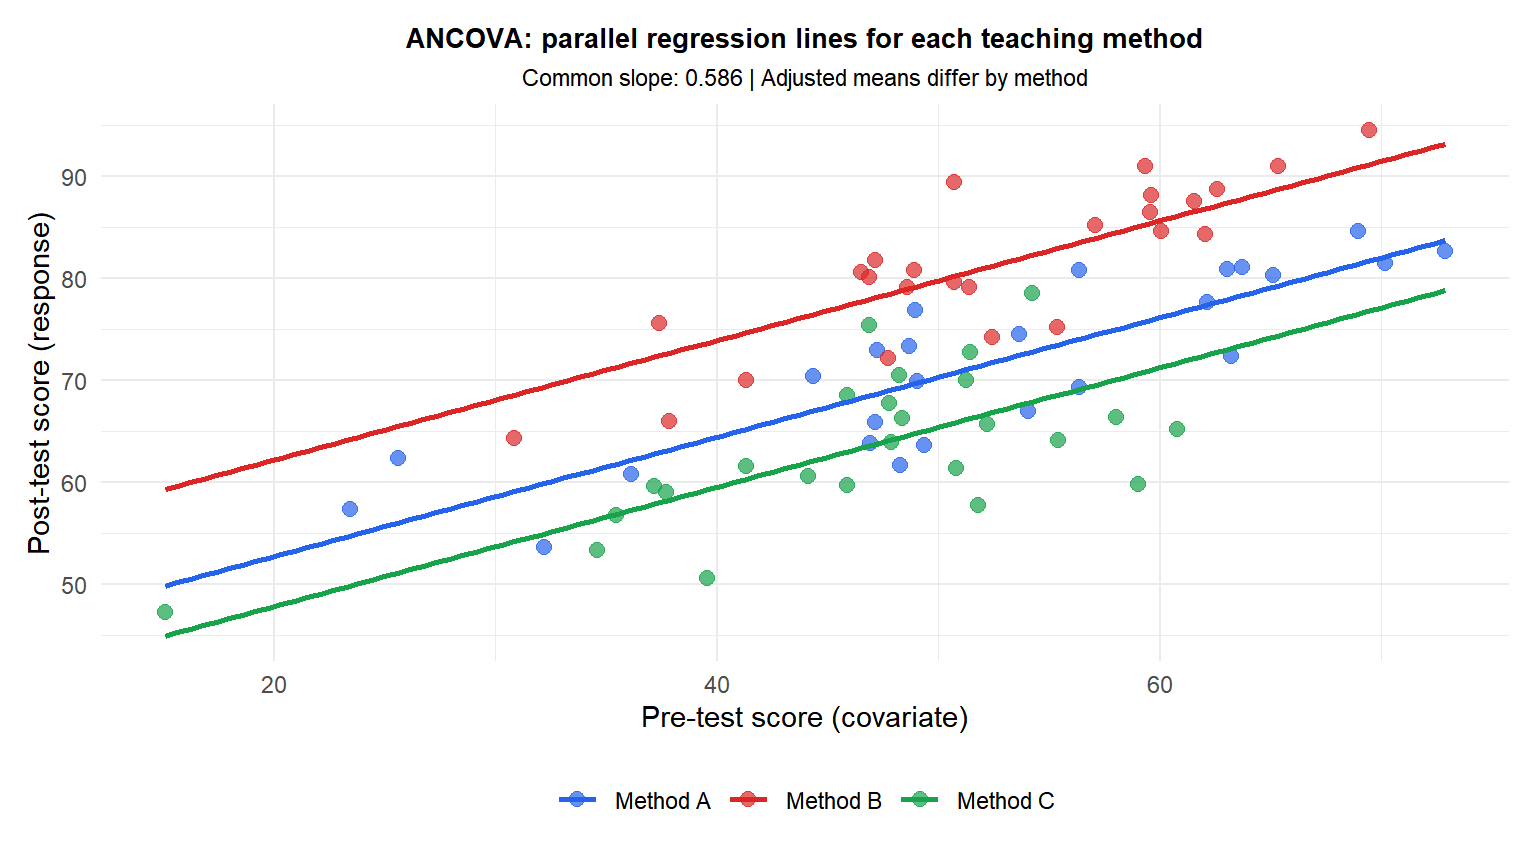
The three parallel lines have the same slope (the covariate effect) but different intercepts (the group effects). The vertical separation between lines measures the adjusted group difference.
Adjusted (estimated marginal) means
The adjusted mean for group \(i\) is the predicted value when the covariate \(z\) is held at its grand mean \(\bar{z}\):
\[\hat{\mu}_i^{\text{adj}} = \hat{\mu} + \hat{\alpha}_i + \hat{\gamma}\bar{z}\]
Adjusted means answer: “what would the group means be if all groups had the same average pre-test score?” This is the quantity of primary interest in ANCOVA.
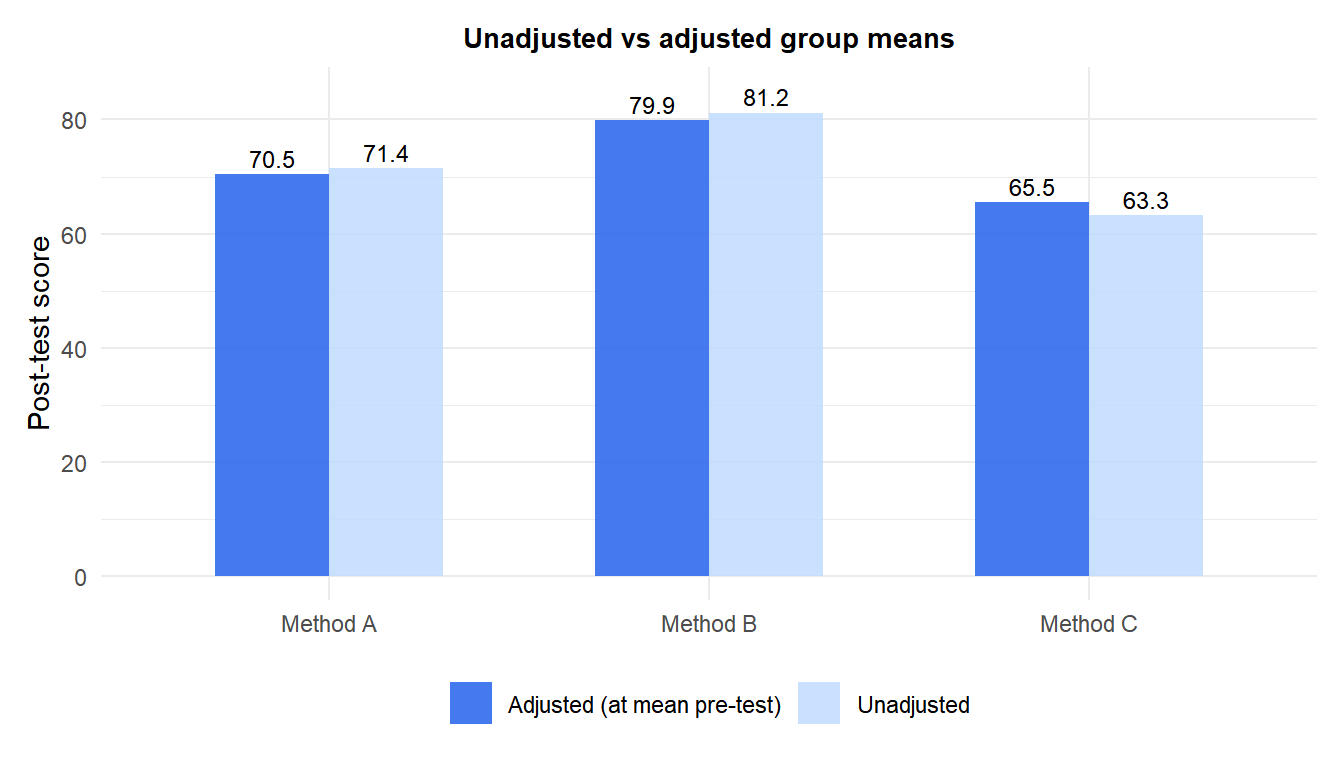
Adjusting for pre-test score shifts the means: groups that started with higher prior knowledge get their means reduced, making the comparison fairer.
The critical assumption: homogeneity of slopes
ANCOVA assumes the covariate has the same relationship with the response in every group (parallel lines). If the slopes differ, the groups interact with the covariate and a single adjusted mean per group is misleading.
Test: fit the interaction model lm(y ~ group * z) and compare to the ANCOVA model lm(y ~ group + z) with an F-test or likelihood ratio test. A significant interaction means the slopes differ and standard ANCOVA is not appropriate.
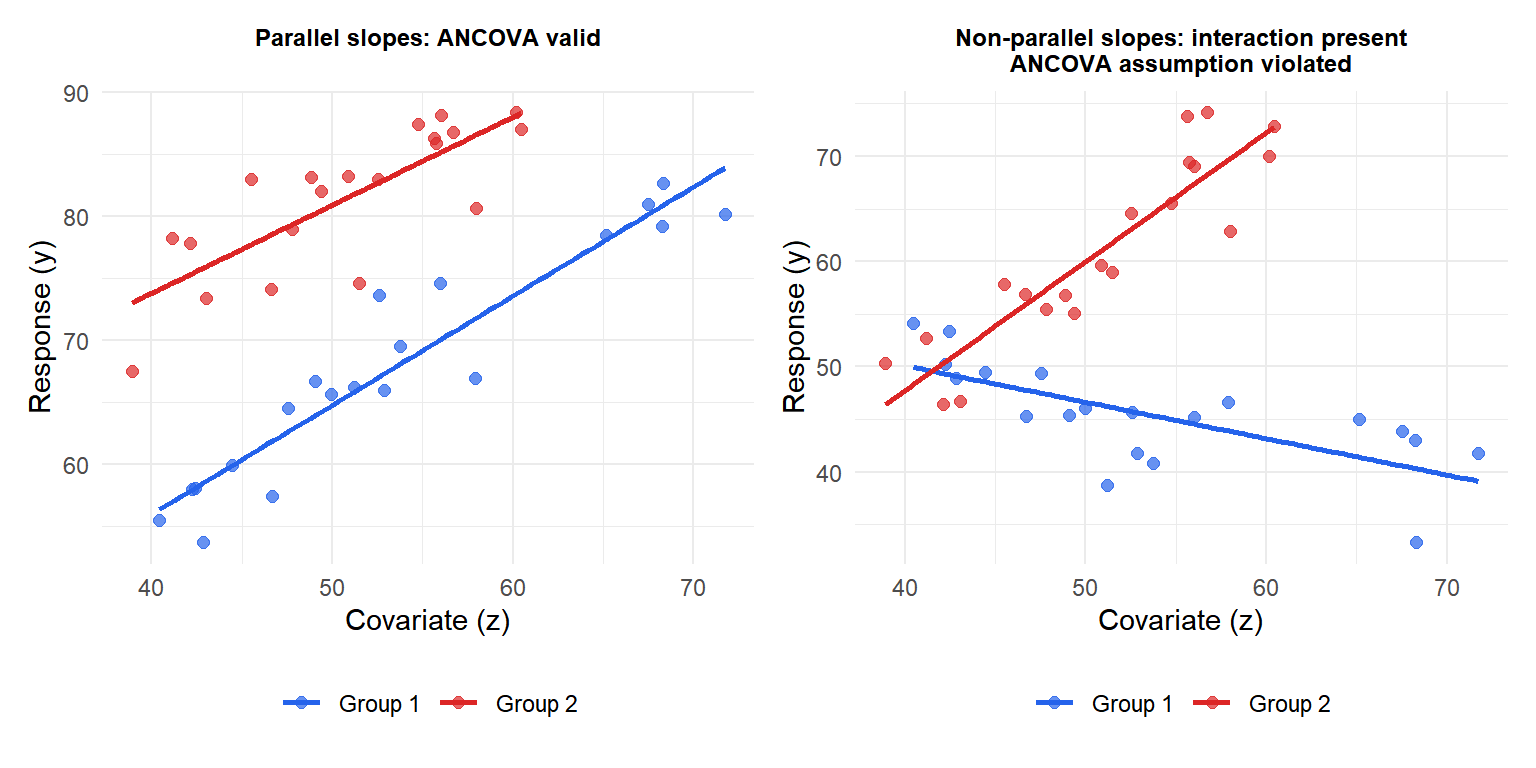
When slopes are non-parallel (right), the group comparison depends on the value of \(z\): at low \(z\), Group 1 scores higher; at high \(z\), Group 2 scores higher. A single adjusted mean per group misrepresents this pattern entirely.
⚠️ ANCOVA in observational studies requires caution
In randomized experiments, random assignment ensures the covariate is balanced across groups before treatment: ANCOVA adjustments are clean. In observational studies, the covariate may be a mediator (on the causal path between group and outcome) rather than a confounder. Adjusting for a mediator blocks part of the treatment effect and produces biased estimates.
Example: if studying the effect of a diet intervention on weight, and the intervention works partly by reducing caloric intake, adjusting for caloric intake in ANCOVA would remove part of the treatment effect you are trying to measure.
Before including a covariate in ANCOVA, think carefully about whether it is a confounder (adjust), a mediator (do not adjust), or neither.
💡 ANCOVA in R
# Fit ANCOVA
fit <- lm(post ~ method + pre, data=df)
summary(fit)
anova(fit)    # F-tests for method and pre

# Test homogeneity of slopes (interaction)
fit_int <- lm(post ~ method * pre, data=df)
anova(fit, fit_int)   # significant -> slopes differ, ANCOVA not valid

# Adjusted (estimated marginal) means
library(emmeans)
emmeans(fit, "method")               # adjusted at grand mean of pre
emmeans(fit, "method", at=list(pre=55))  # adjusted at specific pre value

# Pairwise comparisons of adjusted means
pairs(emmeans(fit, "method"))
