Hypothesis testing for variance
The chi-squared test for variance evaluates whether a population variance equals a specified value. It is the standard tool for one-sample variance testing, but it is highly sensitive to departures from normality: more so than almost any other common test.
Hypotheses
| Test | \(H_0\) | \(H_1\) |
|---|---|---|
| Two-sided | \(\sigma^2 = \sigma_0^2\) | \(\sigma^2 \neq \sigma_0^2\) |
| One-sided right | \(\sigma^2 = \sigma_0^2\) | \(\sigma^2 > \sigma_0^2\) |
| One-sided left | \(\sigma^2 = \sigma_0^2\) | \(\sigma^2 < \sigma_0^2\) |
Test statistic
Given a sample of size \(n\) with sample variance \(S^2\), the test statistic is:
\[\chi^2 = \frac{(n-1)S^2}{\sigma_0^2}\]
Under \(H_0\) and the assumption of normality, this follows a \(\chi^2\) distribution with \(n - 1\) degrees of freedom. The p-value is computed from this distribution.
⚠️ This test is extremely sensitive to non-normality
Unlike the \(t\)-test for the mean (which is fairly robust to non-normality thanks to the CLT), the chi-squared test for variance is not robust at all. Non-normal data can produce highly significant results even when the variance has not changed, and can mask real changes. Before applying this test:
- Check normality with a Q-Q plot or Shapiro-Wilk test.
- If normality is in doubt, use a bootstrap test for the variance or report a bootstrap confidence interval instead.
- Levene’s test is more robust for comparing variances across groups.
Examples
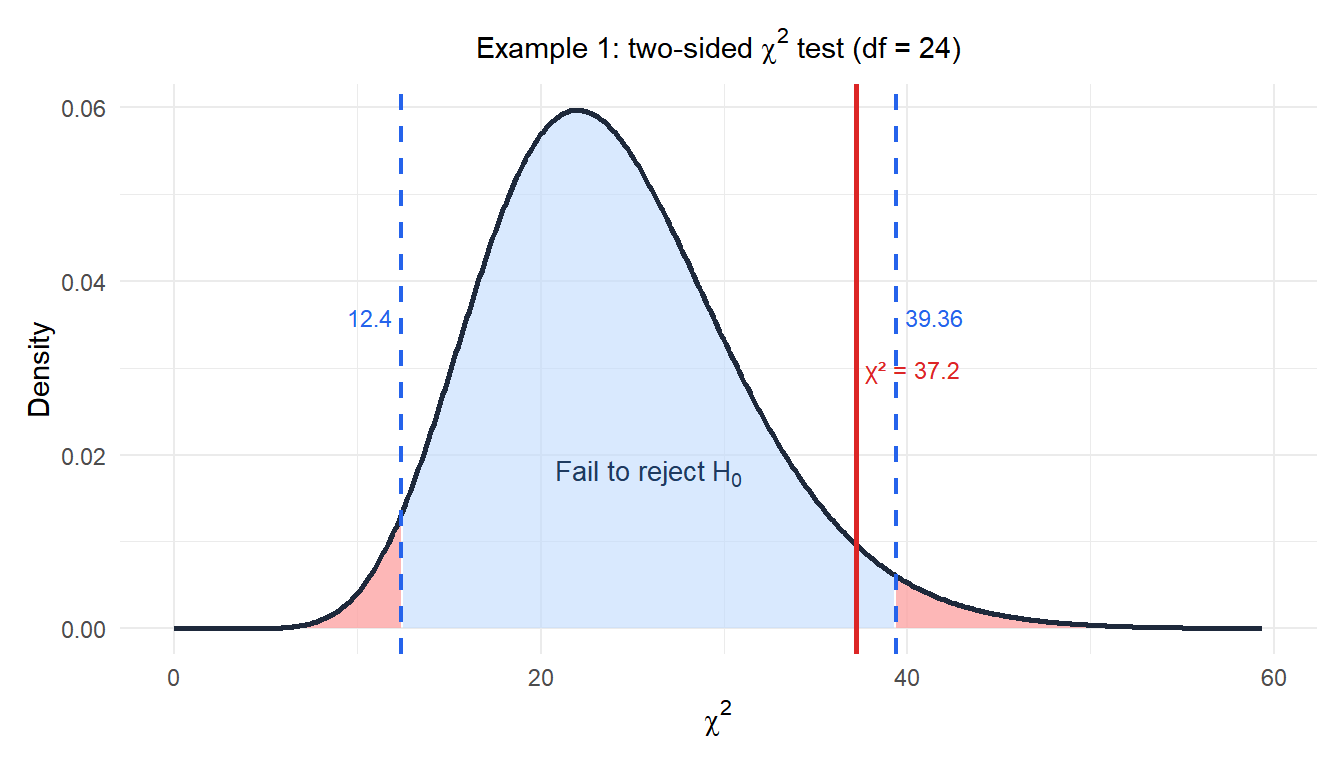
Example 1: packaging weight consistency (two-sided)
A food manufacturer specifies that the variance in package weight must not exceed \(\sigma_0^2 = 4\) g². A quality inspector samples 25 packages and finds \(S^2 = 6.2\) g². Is there evidence that the variance has changed?
Hypotheses: \(H_0: \sigma^2 = 4\) vs \(H_1: \sigma^2 \neq 4\).
Test statistic:
\[\chi^2 = \frac{24 \times 6.2}{4} = \frac{148.8}{4} = 37.2\]
p-value (two-sided, \(df = 24\)):
\[p = 2 \times \min\!\left(P(\chi^2_{24} \leq 37.2),\; P(\chi^2_{24} \geq 37.2)\right) = 2 \times P(\chi^2_{24} \geq 37.2) \approx 2 \times 0.036 = 0.072\]
Decision: \(p = 0.072 > 0.05\), fail to reject \(H_0\).
The data do not provide significant evidence at the 5% level that the variance differs from 4 g². However, the result is borderline: \(S^2 = 6.2\) g² is 55% above the target, which may be practically concerning even if not statistically significant.
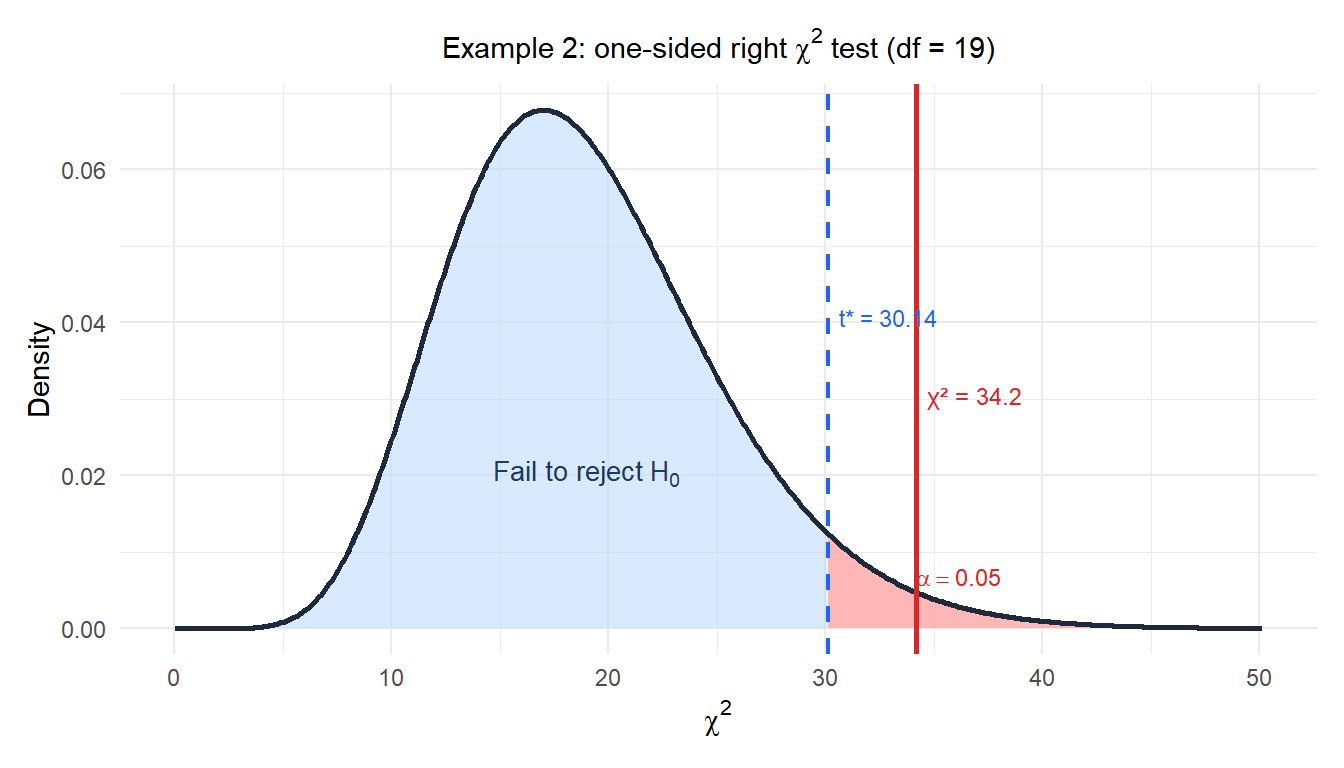
Example 2: measurement instrument precision (one-sided right)
A laboratory claims their scale has a variance of at most \(\sigma_0^2 = 0.01\) mg². A metrologist takes 20 measurements and finds \(S^2 = 0.018\) mg². Is there evidence the variance exceeds the specification?
Hypotheses: \(H_0: \sigma^2 = 0.01\) vs \(H_1: \sigma^2 > 0.01\).
Test statistic:
\[\chi^2 = \frac{19 \times 0.018}{0.01} = \frac{0.342}{0.01} = 34.2\]
p-value (one-sided right, \(df = 19\)):
\[p = P(\chi^2_{19} \geq 34.2) \approx 0.017\]
Decision: \(p = 0.017 < 0.05\), reject \(H_0\).
There is significant evidence that the scale’s variance exceeds the specification. The instrument should be recalibrated or replaced.
Running the test in R
There is no built-in var.test() for one-sample variance in R (that function compares two variances). Use:
# Manual chi-squared test for variance
n    <- 25
s2   <- 6.2
sig0 <- 4
chi2_stat <- (n - 1) * s2 / sig0
df   <- n - 1

# Two-sided p-value
p_val <- 2 * min(pchisq(chi2_stat, df), pchisq(chi2_stat, df, lower.tail = FALSE))

# Or using the EnvStats package
library(EnvStats)
varTest(x, sigma.squared = 4, alternative = "two.sided")
💡 When to use this test
Use the chi-squared test for variance when:
- You want to test whether a process variance meets a specification (\(H_0: \sigma^2 = \sigma_0^2\)).
- The data are continuous and approximately normal.
- The sample is a single group (for two-group variance comparison, use the F-test or Levene’s test).
Always verify normality before applying this test. A significant result in a non-normal dataset may reflect skewness or heavy tails rather than a change in variance.

