F-test for equality of variances
The F-test compares the variances of two independent populations by forming the ratio of their sample variances. It is used as a preliminary check before pooled t-tests, but its extreme sensitivity to non-normality makes Levene’s test a more robust alternative in most practical situations.
Context: two uses of the F distribution
The F distribution appears in two different testing contexts that should not be confused:
- F-test for two variances: tests \(H_0: \sigma_1^2 = \sigma_2^2\) using the ratio \(S_1^2/S_2^2\). This is the subject of this post.
- F-test in ANOVA: tests equality of means across three or more groups using the ratio of between-group to within-group variance. Covered in the ANOVA post.
Both use the F distribution but answer completely different questions.
Hypotheses
| Test | \(H_0\) | \(H_1\) |
|---|---|---|
| Two-sided | \(\sigma_1^2 = \sigma_2^2\) | \(\sigma_1^2 \neq \sigma_2^2\) |
| One-sided right | \(\sigma_1^2 = \sigma_2^2\) | \(\sigma_1^2 > \sigma_2^2\) |
| One-sided left | \(\sigma_1^2 = \sigma_2^2\) | \(\sigma_1^2 < \sigma_2^2\) |
Test statistic
Given two independent samples with sample variances \(S_1^2\) (\(n_1\) observations) and \(S_2^2\) (\(n_2\) observations):
\[F = \frac{S_1^2}{S_2^2}\]
Under \(H_0\) and the assumption that both populations are normal, \(F \sim F(n_1-1,\, n_2-1)\).
By convention, place the larger variance in the numerator for a one-sided right test. For two-sided tests, the p-value is \(2 \times \min(P(F \leq F_\text{obs}),\, P(F \geq F_\text{obs}))\).
⚠️ The F-test is extremely sensitive to non-normality
Unlike the t-test (which is robust to mild non-normality), the F-test for variances is not robust at all. Non-normal data can produce highly significant results even when the population variances are equal, simply because the ratio of sample variances is sensitive to skewness and heavy tails.
For non-normal data, use:
- Levene’s test: based on absolute deviations from the group median. Much more robust. Available in R via
car::leveneTest(). - Brown-Forsythe test: similar to Levene but uses the median instead of the mean, even more robust to outliers. Available via
lawstat::levene.test(..., location = "median").
Use the F-test only when you have verified that both samples come from normal distributions.
Examples
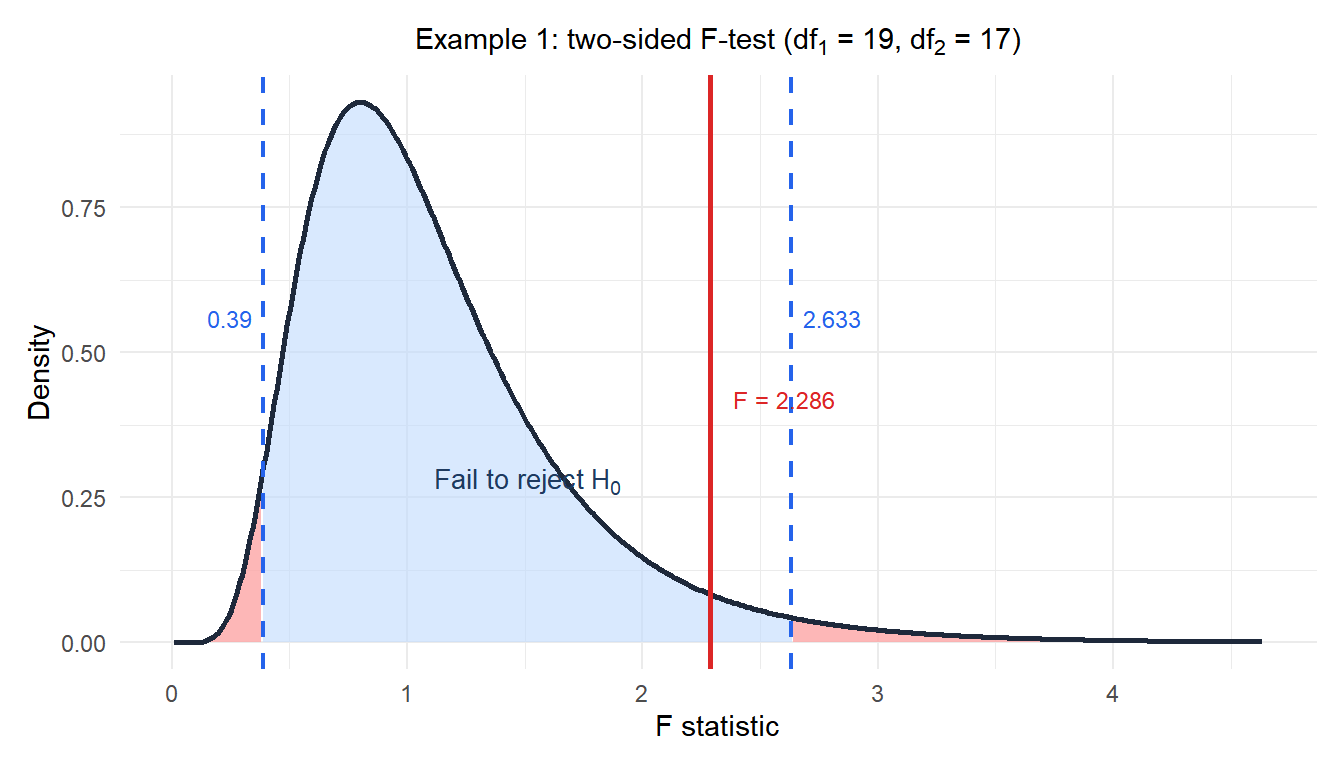
Example 1: consistency of two production lines (two-sided)
A factory runs two production lines making the same component. Quality engineers sample 20 units from Line 1 (\(S_1^2 = 4.8\) mm²) and 18 units from Line 2 (\(S_2^2 = 2.1\) mm²). Is there evidence that the variability differs between lines?
Hypotheses: \(H_0: \sigma_1^2 = \sigma_2^2\) vs \(H_1: \sigma_1^2 \neq \sigma_2^2\).
Test statistic:
\[F = \frac{4.8}{2.1} \approx 2.286 \quad (df_1 = 19,\; df_2 = 17)\]
p-value (two-sided):
\[p = 2 \times P(F_{19,17} \geq 2.286) \approx 2 \times 0.061 = 0.122\]
Decision: \(p = 0.122 > 0.05\), fail to reject \(H_0\).
No significant evidence of a difference in variability between the two lines at the 5% level.
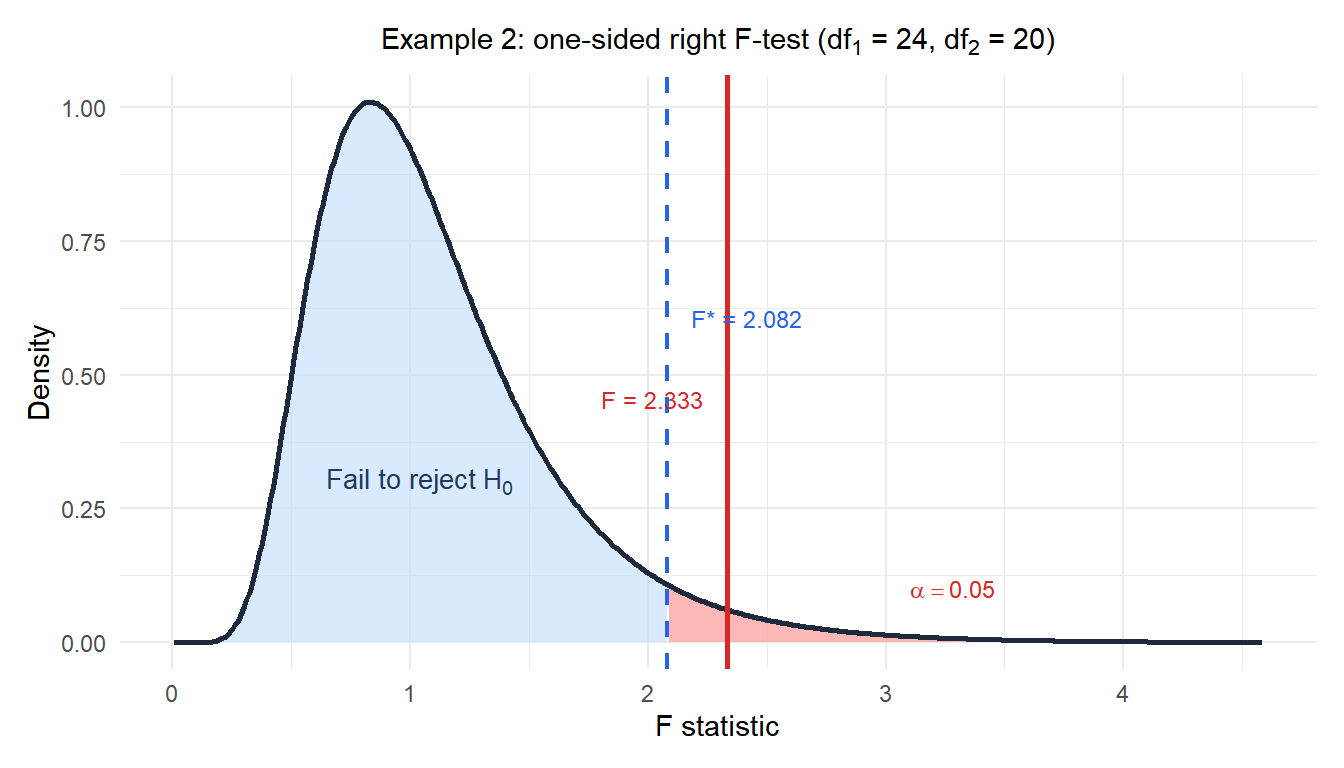
Example 2: new instrument precision (one-sided right)
A lab claims a new measurement instrument is more precise than the current one. Current instrument: \(n_1 = 25\) measurements, \(S_1^2 = 0.042\) mg². New instrument: \(n_2 = 21\) measurements, \(S_2^2 = 0.018\) mg². Is there evidence the current instrument is more variable?
Hypotheses: \(H_0: \sigma_1^2 = \sigma_2^2\) vs \(H_1: \sigma_1^2 > \sigma_2^2\).
Test statistic:
\[F = \frac{0.042}{0.018} \approx 2.333 \quad (df_1 = 24,\; df_2 = 20)\]
p-value (one-sided right):
\[p = P(F_{24,20} \geq 2.333) \approx 0.038\]
Decision: \(p = 0.038 < 0.05\), reject \(H_0\).
The current instrument is significantly more variable than the new one. The lab’s claim of improved precision is supported.
Connection with the confidence interval
A \((1-\alpha)\) CI for \(\sigma_1^2/\sigma_2^2\) is directly linked to the two-sided F-test: if the CI excludes 1, the test rejects \(H_0\) at level \(\alpha\). The CI also shows the magnitude of the variance ratio, which the p-value alone does not reveal.
For Example 1: \(\text{CI} = (F/F_{0.975},\; F/F_{0.025}) = (2.286/2.769,\; 2.286/0.393) = (0.83,\; 5.82)\). Since 1 is inside the interval, the test does not reject \(H_0\), consistent with \(p = 0.122\).
Running the test in R
# F-test for equality of variances
var.test(x1, x2, alternative = "two.sided")
var.test(x1, x2, alternative = "greater")

# Levene's test (more robust, recommended for non-normal data)
library(car)
leveneTest(value ~ group, data = df)

# Brown-Forsythe test
library(lawstat)
levene.test(value, group, location = "median")
var.test() in R places the larger variance in the numerator by default when alternative = "greater".
💡 Which test to use for variance comparison
- Data are normal (verified by Shapiro-Wilk or Q-Q plot): use the F-test (
var.test()). - Data are non-normal or normality is uncertain: use Levene’s test (
car::leveneTest()). - Data have extreme outliers or very heavy tails: use Brown-Forsythe.
- You only need to check the equal-variance assumption before a pooled t-test: note that Welch’s t-test does not require equal variances and is preferred by default. The variance test is often unnecessary if you simply use Welch.

