What is a confidence interval?
A confidence interval gives a range of plausible values for an unknown population parameter, constructed from sample data. The confidence level does not describe a probability about the parameter: it describes the reliability of the procedure used to build the interval.
Definition
A confidence interval (CI) is an interval \([L, U]\) constructed from sample data such that, if the sampling and construction procedure were repeated many times, a specified proportion of the resulting intervals would contain the true population parameter. Its general structure is:
\[\text{CI} = \text{Point Estimate} \pm \text{Margin of Error}\]
For a population mean \(\mu\), the specific forms are:
\[\bar{X} \pm z_{\alpha/2} \cdot \frac{\sigma}{\sqrt{n}} \quad \text{(when } \sigma \text{ is known)}\]
\[\bar{X} \pm t_{\alpha/2,\, n-1} \cdot \frac{S}{\sqrt{n}} \quad \text{(when } \sigma \text{ is unknown, which is almost always)}\]
The term \(z_{\alpha/2} \cdot \sigma/\sqrt{n}\) (or the equivalent with \(t\)) is the margin of error: half the width of the interval.
⚠️ The most common misinterpretation of confidence intervals
Wrong: “There is a 95% probability that the true mean lies in the interval \([68.0, 72.0]\).”
Correct: “If we repeated this study many times and built a 95% CI each time, approximately 95% of those intervals would contain the true mean.”
The distinction matters because \(\mu\) is a fixed (unknown) constant, not a random variable. Once you have computed the interval, either it contains \(\mu\) or it does not: the probability is 0 or 1. The 95% refers to the long-run frequency of the procedure, not to any specific interval.
In Bayesian statistics, credible intervals do have a direct probability interpretation. Frequentist confidence intervals do not.
What confidence intervals look like in practice
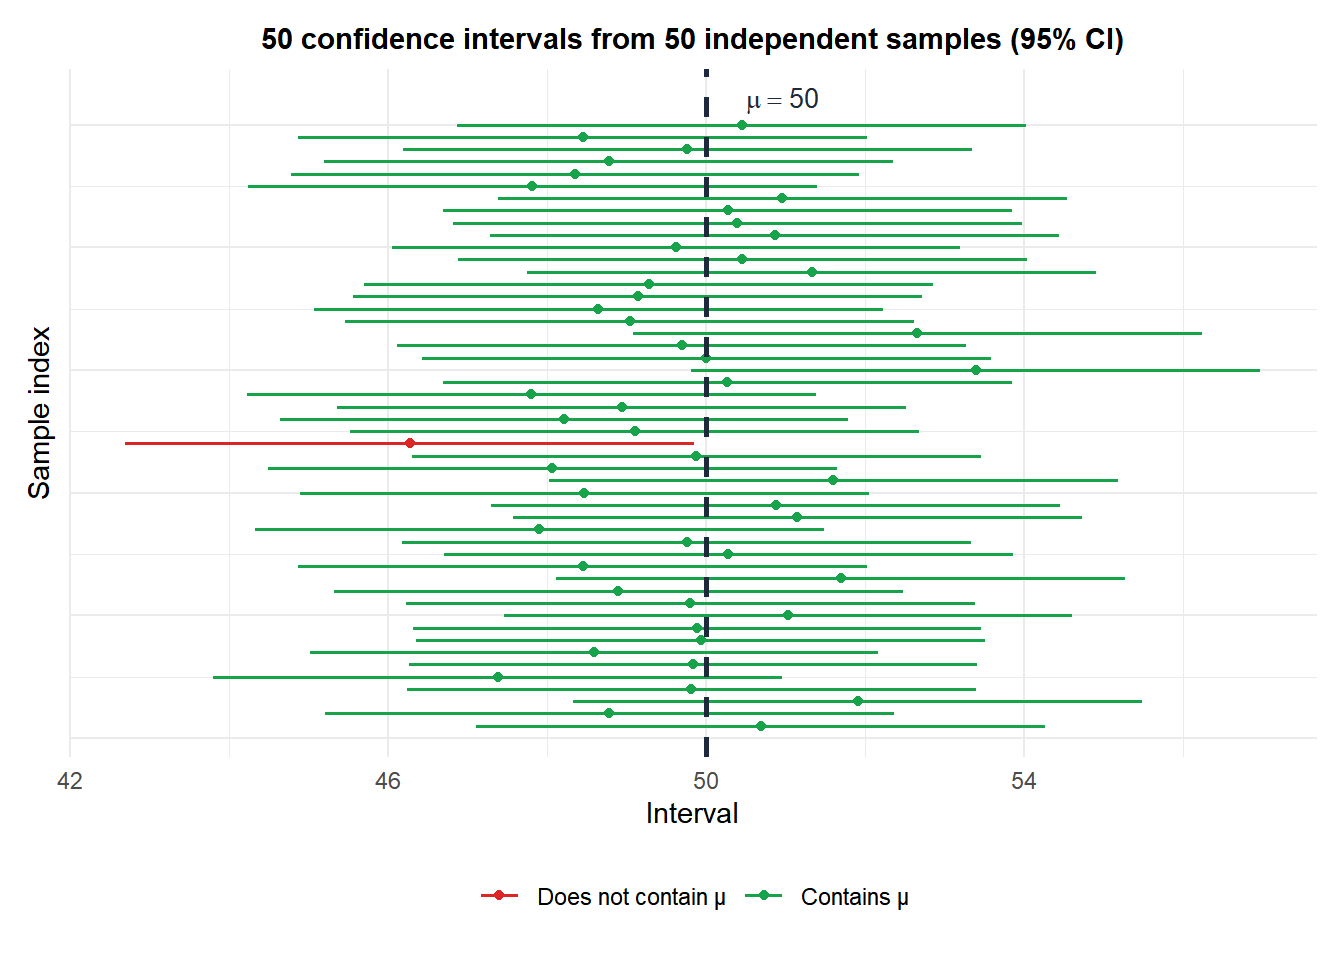
Most intervals (green) contain the true \(\mu = 50\). A few (red) do not: this is expected. In a large number of repetitions, exactly 95% would cover \(\mu\).
Confidence level and interval width
The confidence level \((1-\alpha)\) controls the tradeoff between certainty and precision:
- Higher confidence level: wider interval, more certain to contain \(\mu\), less informative.
- Lower confidence level: narrower interval, more precise, but more likely to miss \(\mu\).
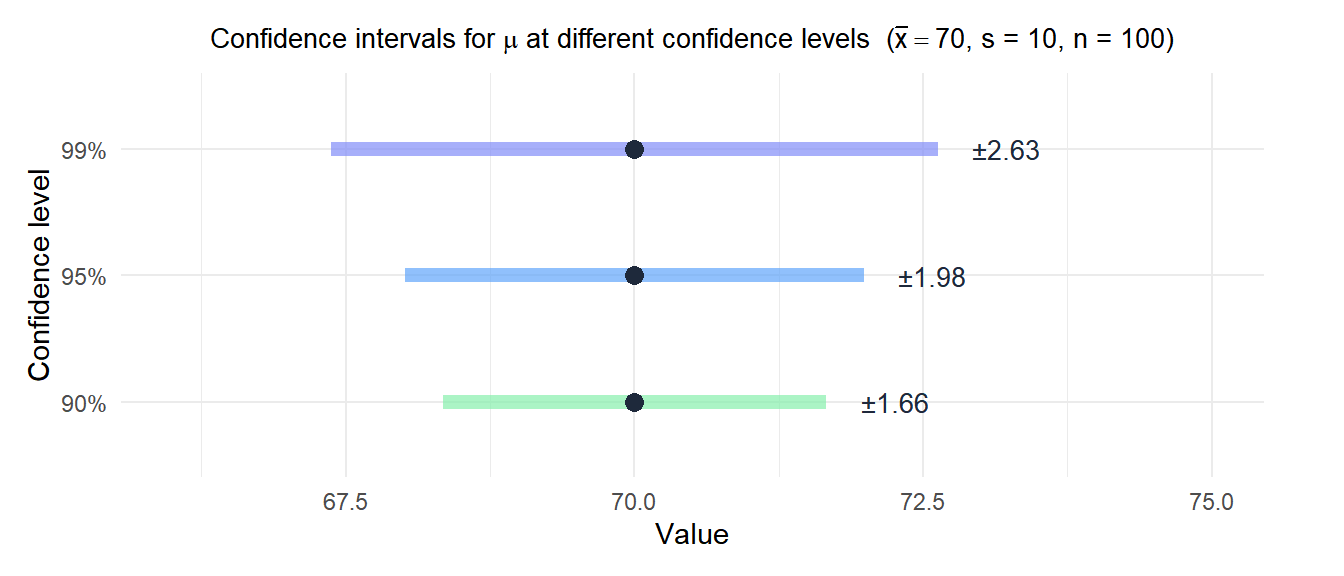
For the same data (\(\bar{x} = 70\), \(S = 10\), \(n = 100\)):
- 90% CI: \(70 \pm 1.66\) = \([68.34,\, 71.66]\)
- 95% CI: \(70 \pm 1.98\) = \([68.02,\, 71.98]\)
- 99% CI: \(70 \pm 2.63\) = \([67.37,\, 72.63]\)
More confidence requires a wider net.
Factors affecting interval width
The margin of error \(t_{\alpha/2} \cdot S/\sqrt{n}\) depends on three things:
- Confidence level: higher \((1-\alpha)\) gives larger \(t_{\alpha/2}\) and wider intervals.
- Sample size \(n\): larger \(n\) reduces the margin of error as \(1/\sqrt{n}\).
- Variability \(S\): more variable data gives wider intervals.
To halve the margin of error, you need to quadruple the sample size.
A hospital records the length of stay for 25 patients: \(\bar{x} = 6.4\) days, \(S = 3.1\) days. Construct a 95% CI for \(\mu\).
Since \(\sigma\) is unknown, use the \(t\) distribution with \(n - 1 = 24\) degrees of freedom.
Critical value: \(t_{0.025,\, 24} = 2.064\).
Margin of error: \(2.064 \times 3.1/\sqrt{25} = 2.064 \times 0.62 = 1.28\).
\[\text{CI} = 6.4 \pm 1.28 = [5.12,\; 7.68] \text{ days}\]
We are 95% confident that the true average length of stay is between 5.1 and 7.7 days. This does not mean there is a 95% chance that \(\mu\) is in this specific interval: it means the procedure that generated this interval succeeds 95% of the time.
Connection with hypothesis testing
A \((1-\alpha)\) confidence interval for \(\mu\) is directly related to a two-sided hypothesis test at significance level \(\alpha\):
- If \(\mu_0\) falls inside the CI, the test \(H_0: \mu = \mu_0\) is not rejected at level \(\alpha\).
- If \(\mu_0\) falls outside the CI, the test is rejected at level \(\alpha\).
The CI and the hypothesis test always give the same conclusion. The CI is often more informative because it shows the whole range of plausible values, not just a binary reject/fail-to-reject decision.
💡 Practical guidelines for confidence intervals
- When \(\sigma\) is unknown (virtually always): use the \(t\) distribution, not \(z\).
- For proportions: use \(\hat{p} \pm z_{\alpha/2}\sqrt{\hat{p}(1-\hat{p})/n}\), and check \(n\hat{p} \geq 10\) and \(n(1-\hat{p}) \geq 10\).
- Wider is not always better: a very wide CI means little precision. Report both the interval and the sample size so readers can judge precision.
- Do not say “the probability that \(\mu\) is in the interval is 95%.” Say “we are 95% confident” or “the procedure captures \(\mu\) 95% of the time.”

