Confidence interval for the difference of paired means
When the same subjects are measured twice, the two observations within each pair are correlated. The paired CI uses this structure to eliminate between-subject variability, producing a narrower and more informative interval than treating the samples as independent.
Why paired analysis?
In a before-and-after study, patients differ from each other in ways that affect the outcome (baseline health, age, genetics). If you ignore the pairing and analyze the two groups as independent samples, all this between-subject variability inflates the standard error, making it harder to detect the treatment effect.
The paired approach eliminates between-subject variability by computing the difference \(d_i = X_{i,\text{after}} - X_{i,\text{before}}\) for each subject. The variability that remains in \(d_i\) reflects only the within-subject effect of the treatment, which is what we actually want to estimate.
⚠️ Analyzing paired data as independent samples is a common and costly mistake
If you have paired data and analyze it ignoring the pairing (two-sample \(t\)-test), the standard error will be larger than necessary and the CI will be wider than it should be. You may fail to detect a real effect simply because you used the wrong method.
The reverse error also exists: treating independent samples as paired (by artificially matching observations) inflates the degrees of freedom and narrows the CI incorrectly.
Always match your analysis to your study design.
Formula
Given \(n\) pairs with differences \(d_i = X_{i,\text{after}} - X_{i,\text{before}}\), compute:
\[\bar{d} = \frac{1}{n}\sum_{i=1}^n d_i, \qquad S_d = \sqrt{\frac{1}{n-1}\sum_{i=1}^n(d_i - \bar{d})^2}, \qquad \text{SE} = \frac{S_d}{\sqrt{n}}\]
A \((1-\alpha)\) CI for the true mean difference \(\mu_d\) is:
\[\bar{d} \pm t_{\alpha/2,\; n-1} \cdot \frac{S_d}{\sqrt{n}}\]
This is identical to the one-sample \(t\) CI applied to the differences \(d_i\). The paired analysis reduces to a one-sample problem.
Step-by-step example
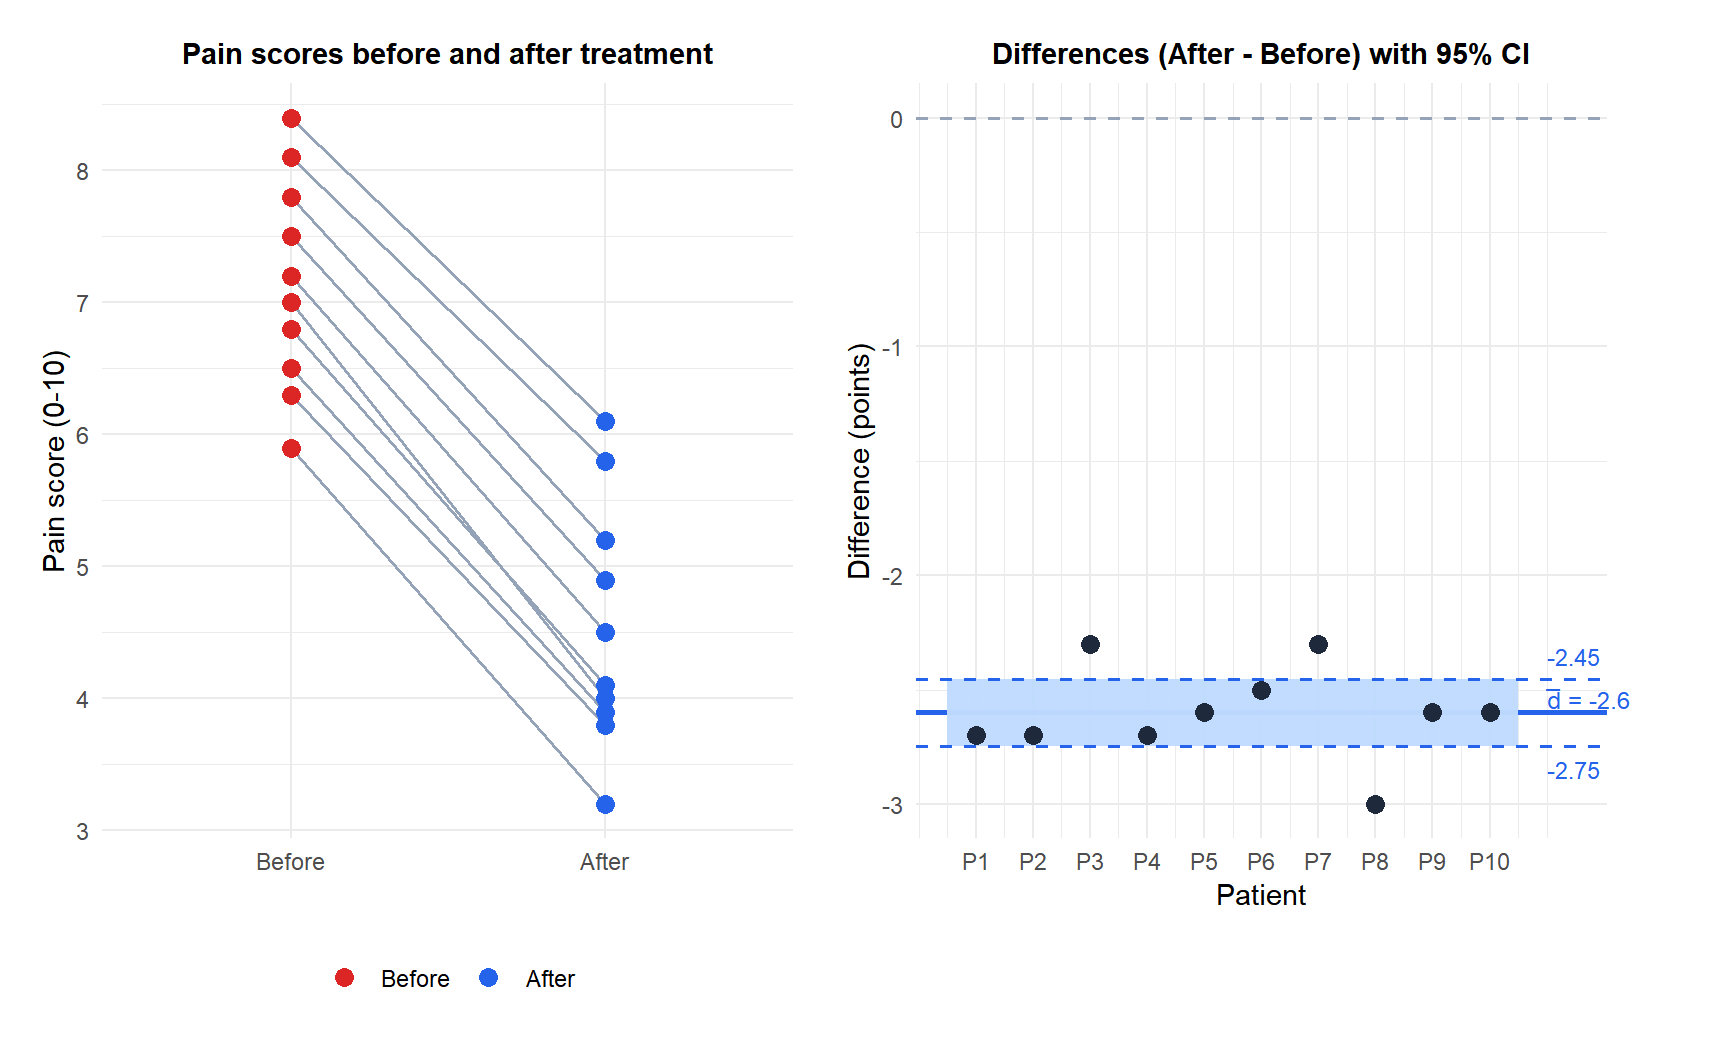
A physiotherapy clinic measures pain scores (0-10 scale) in 10 patients before and after a 4-week treatment. Lower scores are better.
| Patient | Before | After | \(d_i\) = After - Before |
|---|---|---|---|
| 1 | 7.2 | 4.5 | -2.7 |
| 2 | 6.8 | 4.1 | -2.7 |
| 3 | 8.1 | 5.8 | -2.3 |
| 4 | 5.9 | 3.2 | -2.7 |
| 5 | 7.5 | 4.9 | -2.6 |
| 6 | 6.3 | 3.8 | -2.5 |
| 7 | 8.4 | 6.1 | -2.3 |
| 8 | 7.0 | 4.0 | -3.0 |
| 9 | 6.5 | 3.9 | -2.6 |
| 10 | 7.8 | 5.2 | -2.6 |
Step 1: compute \(\bar{d}\) and \(S_d\).
\[\bar{d} = \frac{-2.7 -2.7 -2.3 \cdots -2.6}{10} = -2.60\]
\[S_d = \sqrt{\frac{\sum(d_i - \bar{d})^2}{9}} \approx 0.207\]
Step 2: standard error.
\[\text{SE} = \frac{0.207}{\sqrt{10}} \approx 0.065\]
Step 3: critical value with \(df = 9\).
\[t_{0.025,\; 9} = 2.262\]
Step 4: construct the CI.
\[\text{CI} = -2.60 \pm 2.262 \times 0.065 = -2.60 \pm 0.15 = (-2.75,\; -2.45)\]
We are 95% confident that the treatment reduces pain by between 2.45 and 2.75 points on average. The entire interval is below zero, confirming a statistically significant reduction.
Paired vs independent: the efficiency gain
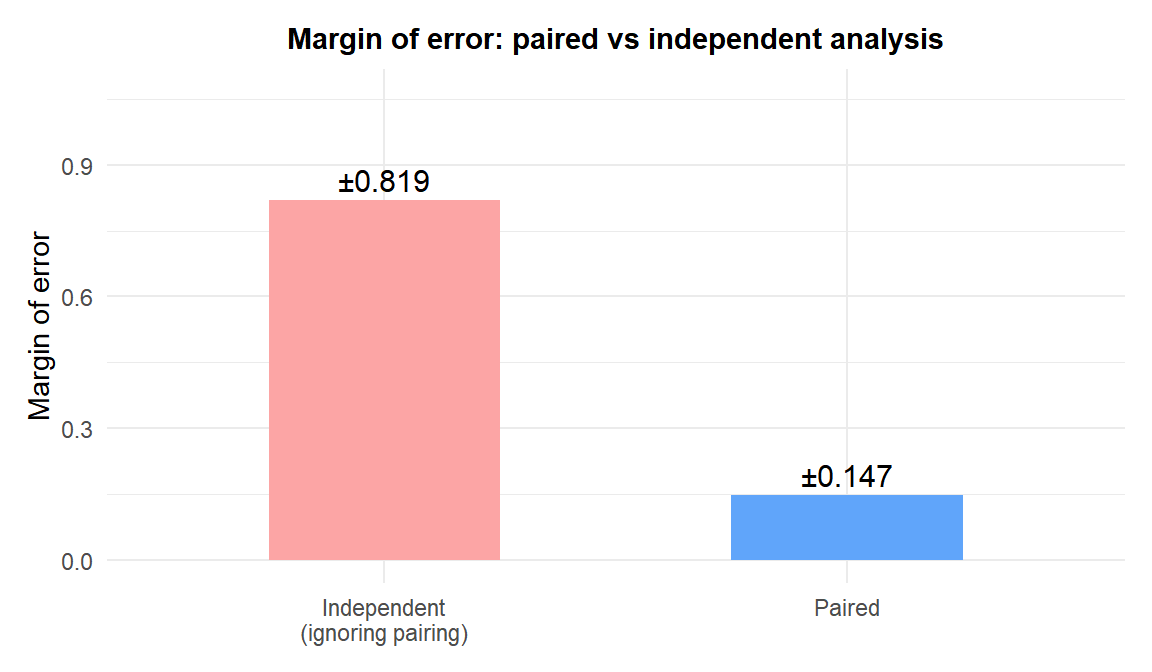
The paired analysis produces a much narrower CI because computing differences within each subject removes the between-subject variability in baseline pain scores.
💡 When to use the paired CI
Use the paired CI when:
- The same subjects are measured twice (before/after, left/right, two treatments in crossover design).
- Observations are matched by design (matched case-control, twins).
Use the independent two-sample CI when:
- Subjects in the two groups are different people with no natural pairing.
- Measurements are taken on different units with no linking structure.
If in doubt, check your study design: was each observation in group 1 specifically linked to one observation in group 2? If yes, use paired.

