Coefficient of variation in statistics
The coefficient of variation (CV) answers a question that standard deviation cannot: which dataset is more variable relative to its own mean? It is the go-to measure when you need to compare variability across datasets with different units or very different average values.
Definition
The coefficient of variation is the ratio of the standard deviation to the mean, expressed as a percentage:
\[ CV = \frac{\sigma}{\bar{x}} \times 100\% \]
where \(\sigma\) is the standard deviation and \(\bar{x}\) is the mean of the dataset.
A CV of 10% means the standard deviation is 10% of the mean. A CV of 80% means the data is highly dispersed relative to its center.
The key property that makes CV useful: it is dimensionless. It has no units, so you can directly compare the variability of salaries in USD with heights in centimeters, or stock prices with bond yields.
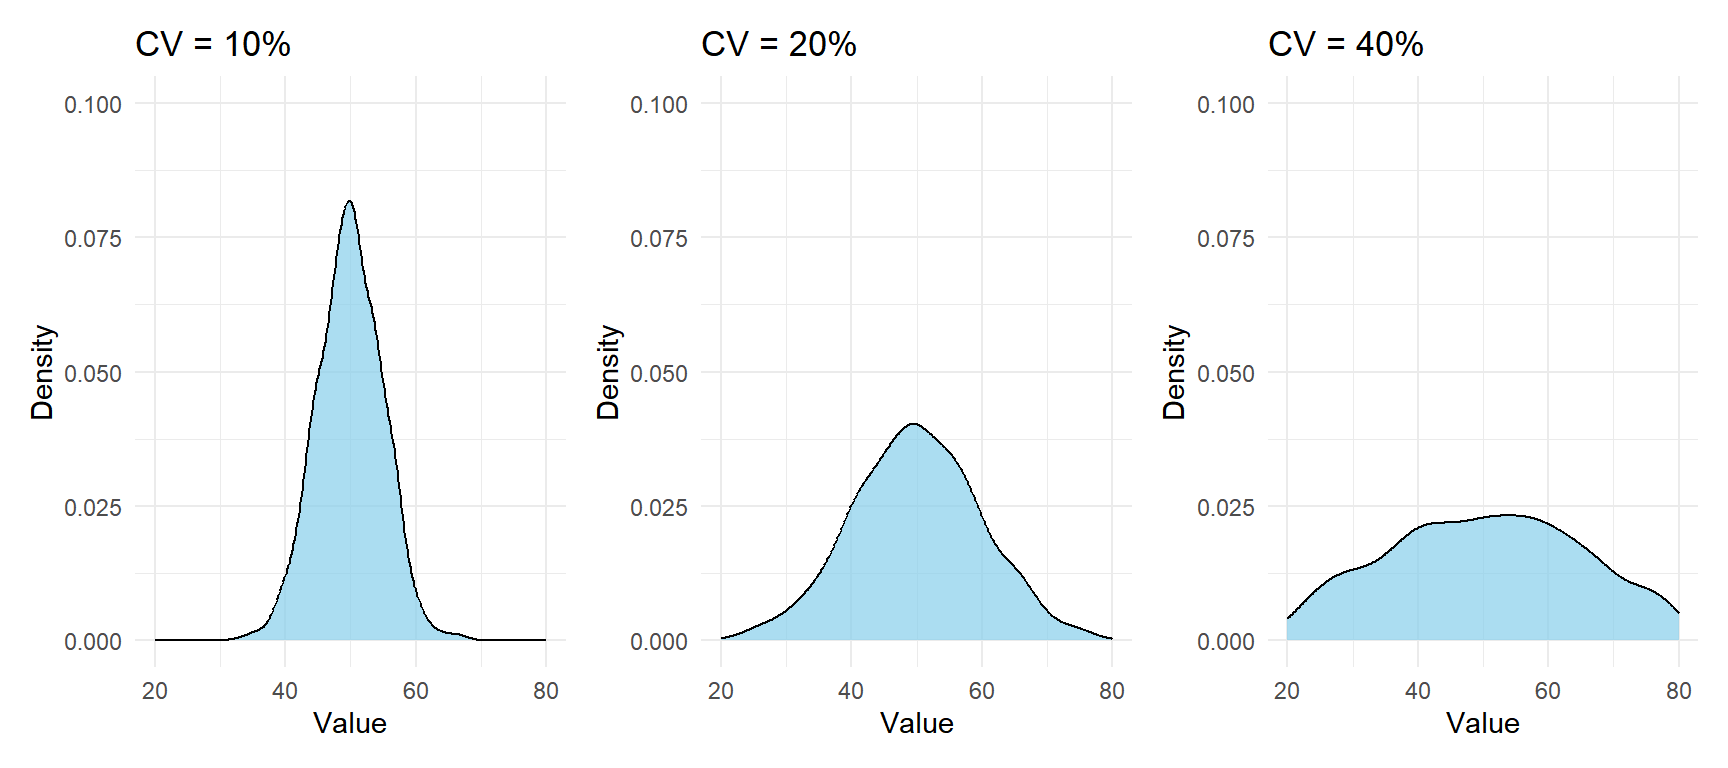
Figure 1: Higher CV means more spread relative to the mean: all three distributions have the same mean but different relative variability
Properties
- Dimensionless: the CV has no units, which is exactly what makes it useful for cross-variable comparisons.
- Always positive: since standard deviation is non-negative and we divide by the mean, CV is positive when the mean is positive.
- Scale invariant: multiplying all values by a constant does not change the CV. Doubling every salary doubles both the mean and the SD, so the ratio stays the same.
- Sensitive to the mean: if the mean is close to zero, the CV becomes very large and loses interpretability. If the mean is negative, the CV is meaningless.
⚠️ The CV does not work when the mean is zero or negative
If your data includes negative values or has a mean near zero, the CV breaks down. A dataset of daily temperature changes in Celsius can have a mean close to zero, making the CV astronomically large or undefined. In those cases, use the standard deviation directly, or switch to a different scale (e.g. Kelvin for temperatures).
Examples
Example 1: comparing two investment assets
A portfolio manager wants to know which of two assets is riskier relative to its return:
- Asset A (tech stock): mean monthly return = 8%, standard deviation = 4%
- Asset B (government bond): mean monthly return = 2%, standard deviation = 1.5%
Comparing standard deviations alone (4% vs 1.5%) suggests Asset A is more volatile. But is it more volatile relative to what it returns?
\[CV_A = \frac{4}{8} \times 100\% = 50\%\]
\[CV_B = \frac{1.5}{2} \times 100\% = 75\%\]
The government bond has a higher CV: it is more volatile relative to its own mean return. For every unit of return, it carries more relative risk than the tech stock. Standard deviation alone would have given the opposite impression.
Example 2: comparing variables with different units
A hospital wants to compare the variability of two patient measurements collected in the same study:
- Height: mean = 170 cm, standard deviation = 8 cm
- Weight: mean = 72 kg, standard deviation = 12 kg
You cannot compare 8 cm with 12 kg directly. The CV makes them comparable:
\[CV_{\text{height}} = \frac{8}{170} \times 100\% \approx 4.7\%\]
\[CV_{\text{weight}} = \frac{12}{72} \times 100\% \approx 16.7\%\]
Weight is considerably more variable relative to its mean than height. This tells the hospital that weight measurements will show more patient-to-patient differences in relative terms.
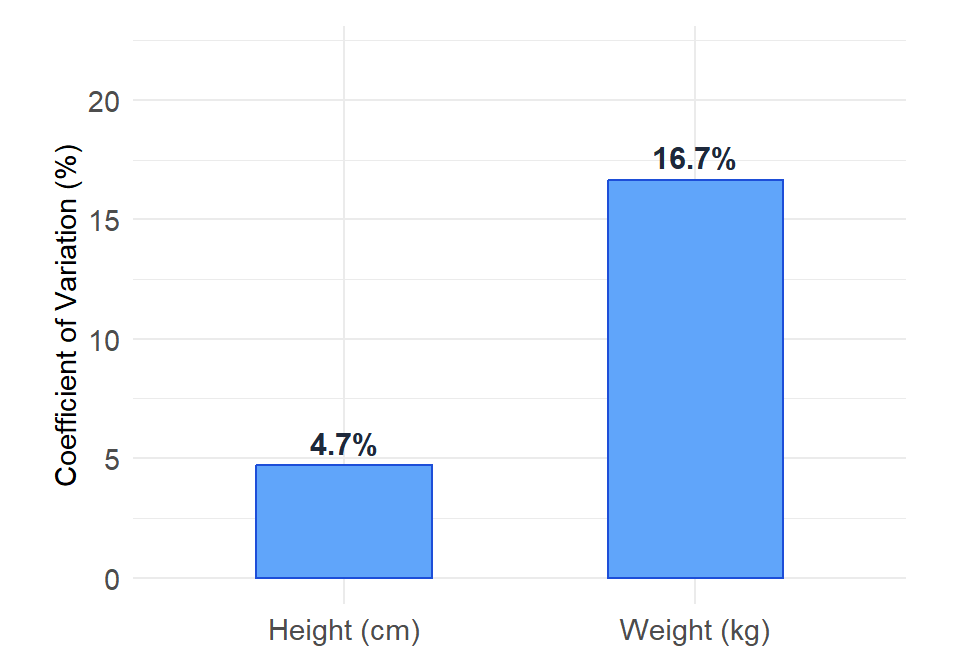
Figure 2: CV allows direct comparison of variability between variables with different units
Example 3: production quality control
A factory produces two types of screws and wants to know which production line has more consistent output:
- Line 1: mean diameter = 5 mm, standard deviation = 0.1 mm → \(CV = 2\%\)
- Line 2: mean diameter = 20 mm, standard deviation = 0.3 mm → \(CV = 1.5\%\)
Even though Line 2 has a larger absolute standard deviation (0.3 mm vs 0.1 mm), its output is actually more consistent relative to the target size. Line 1 is the one with the relatively higher variability.
💡 When to use CV instead of standard deviation
- Comparing variability between variables measured in different units (salaries vs hours, height vs weight).
- Comparing variability between datasets with very different means (a stock priced at 10 USD vs one priced at 500 USD).
- You want a relative measure of risk or consistency, not an absolute one.
Stick with standard deviation when all variables are on the same scale and you need an interpretable measure in the original units.

